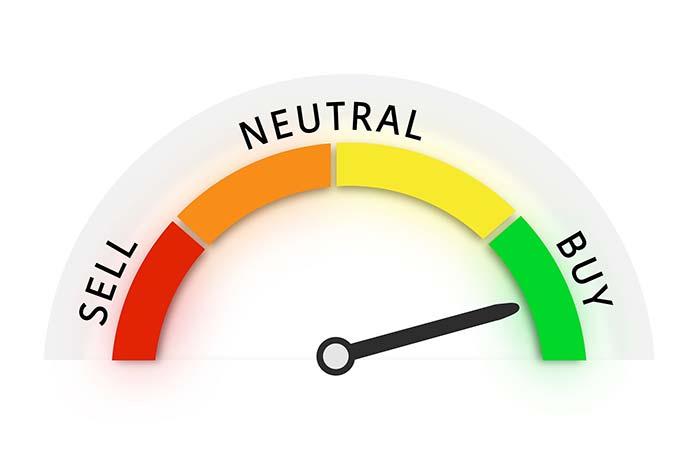
When I first developed the Value Meter system, I wanted to create something different from the usual stock-picking tools. Rather than chase the latest market fads or rely on gut feelings, I aimed to create a straightforward way to spot whether stocks were truly cheap or expensive.
Looking at the results from 2024, I’m pleased to say it’s done exactly that – and then some. Let me show you what I mean with some hard numbers.
Stocks that scored below 3 on our Value Meter scale, suggesting they were undervalued, have gained an average of 4.3% in just 119 days. Stretch that out over a full year, and you’re looking at a projected 13.6% return. Not too shabby in today’s choppy market.
On the other hand, stocks that scored above 3 on our scale have dropped by an average of 11.8% in 114 days – a stunning 42.2% annualized loss.
Even more telling is that since we started including Value Meter scores last May, every single stock that’s fallen by 15% or more had a score above 3.6.
That’s not just correlation; that’s the kind of predictive power that can save investors from serious losses.
So what makes The Value Meter different from other stock rating systems? For one thing, it doesn’t get distracted by surface-level metrics like revenue or price-to-earnings ratio, which often lack context. Instead, it digs deeper into what really matters: how efficiently companies turn their assets into cold, hard cash.
Think of it like buying a house. You wouldn’t just look at the asking price, would you? Of course not. You’d check the condition of the roof, scope out the neighborhood, and research what similar homes have sold for recently. The Value Meter applies that same thorough approach to stocks.
The system zeros in on three crucial factors:
- Enterprise value: how much you’d have to pay to buy the whole company, including all of its outstanding shares
- Net asset value: what the company owns minus what it owes
- Free cash flow: how much cash the business generates from its operations.
By weaving these pieces together, we get a crystal-clear picture of whether a stock is truly cheap or expensive. And as the numbers above show, this approach has been remarkably good at spotting both bargains and danger zones.
But here’s what really sets The Value Meter apart: It doesn’t just find cheap stocks – it finds cheap stocks that are worth buying. Plenty of stocks look cheap, but The Value Meter helps separate the real bargains from the value traps thanks to its laserlike focus on cash generation.
Now, keep in mind that no investing tool is perfect. But in a market where hype often drowns out reality, having a reliable tool to measure true value is more important than ever – and The Value Meter is proving to be one of the sharpest tools we’ve got.
Looking ahead to 2025, I expect The Value Meter to keep doing what it does best: steer investors away from overvalued stocks while pointing them toward undervalued companies with rock-solid fundamentals.
Be excellent,
Anthony
P.S. What stocks would you like me to run through The Value Meter next? Post the ticker symbols in the comments section below.


